The 3D multi-planar reconstruction viewer allows you to navigate a dataset by re-slicing it in any desired orientation while allowing the usage of other standard tools like zooming, panning and quantification.
 Graphical User Interface
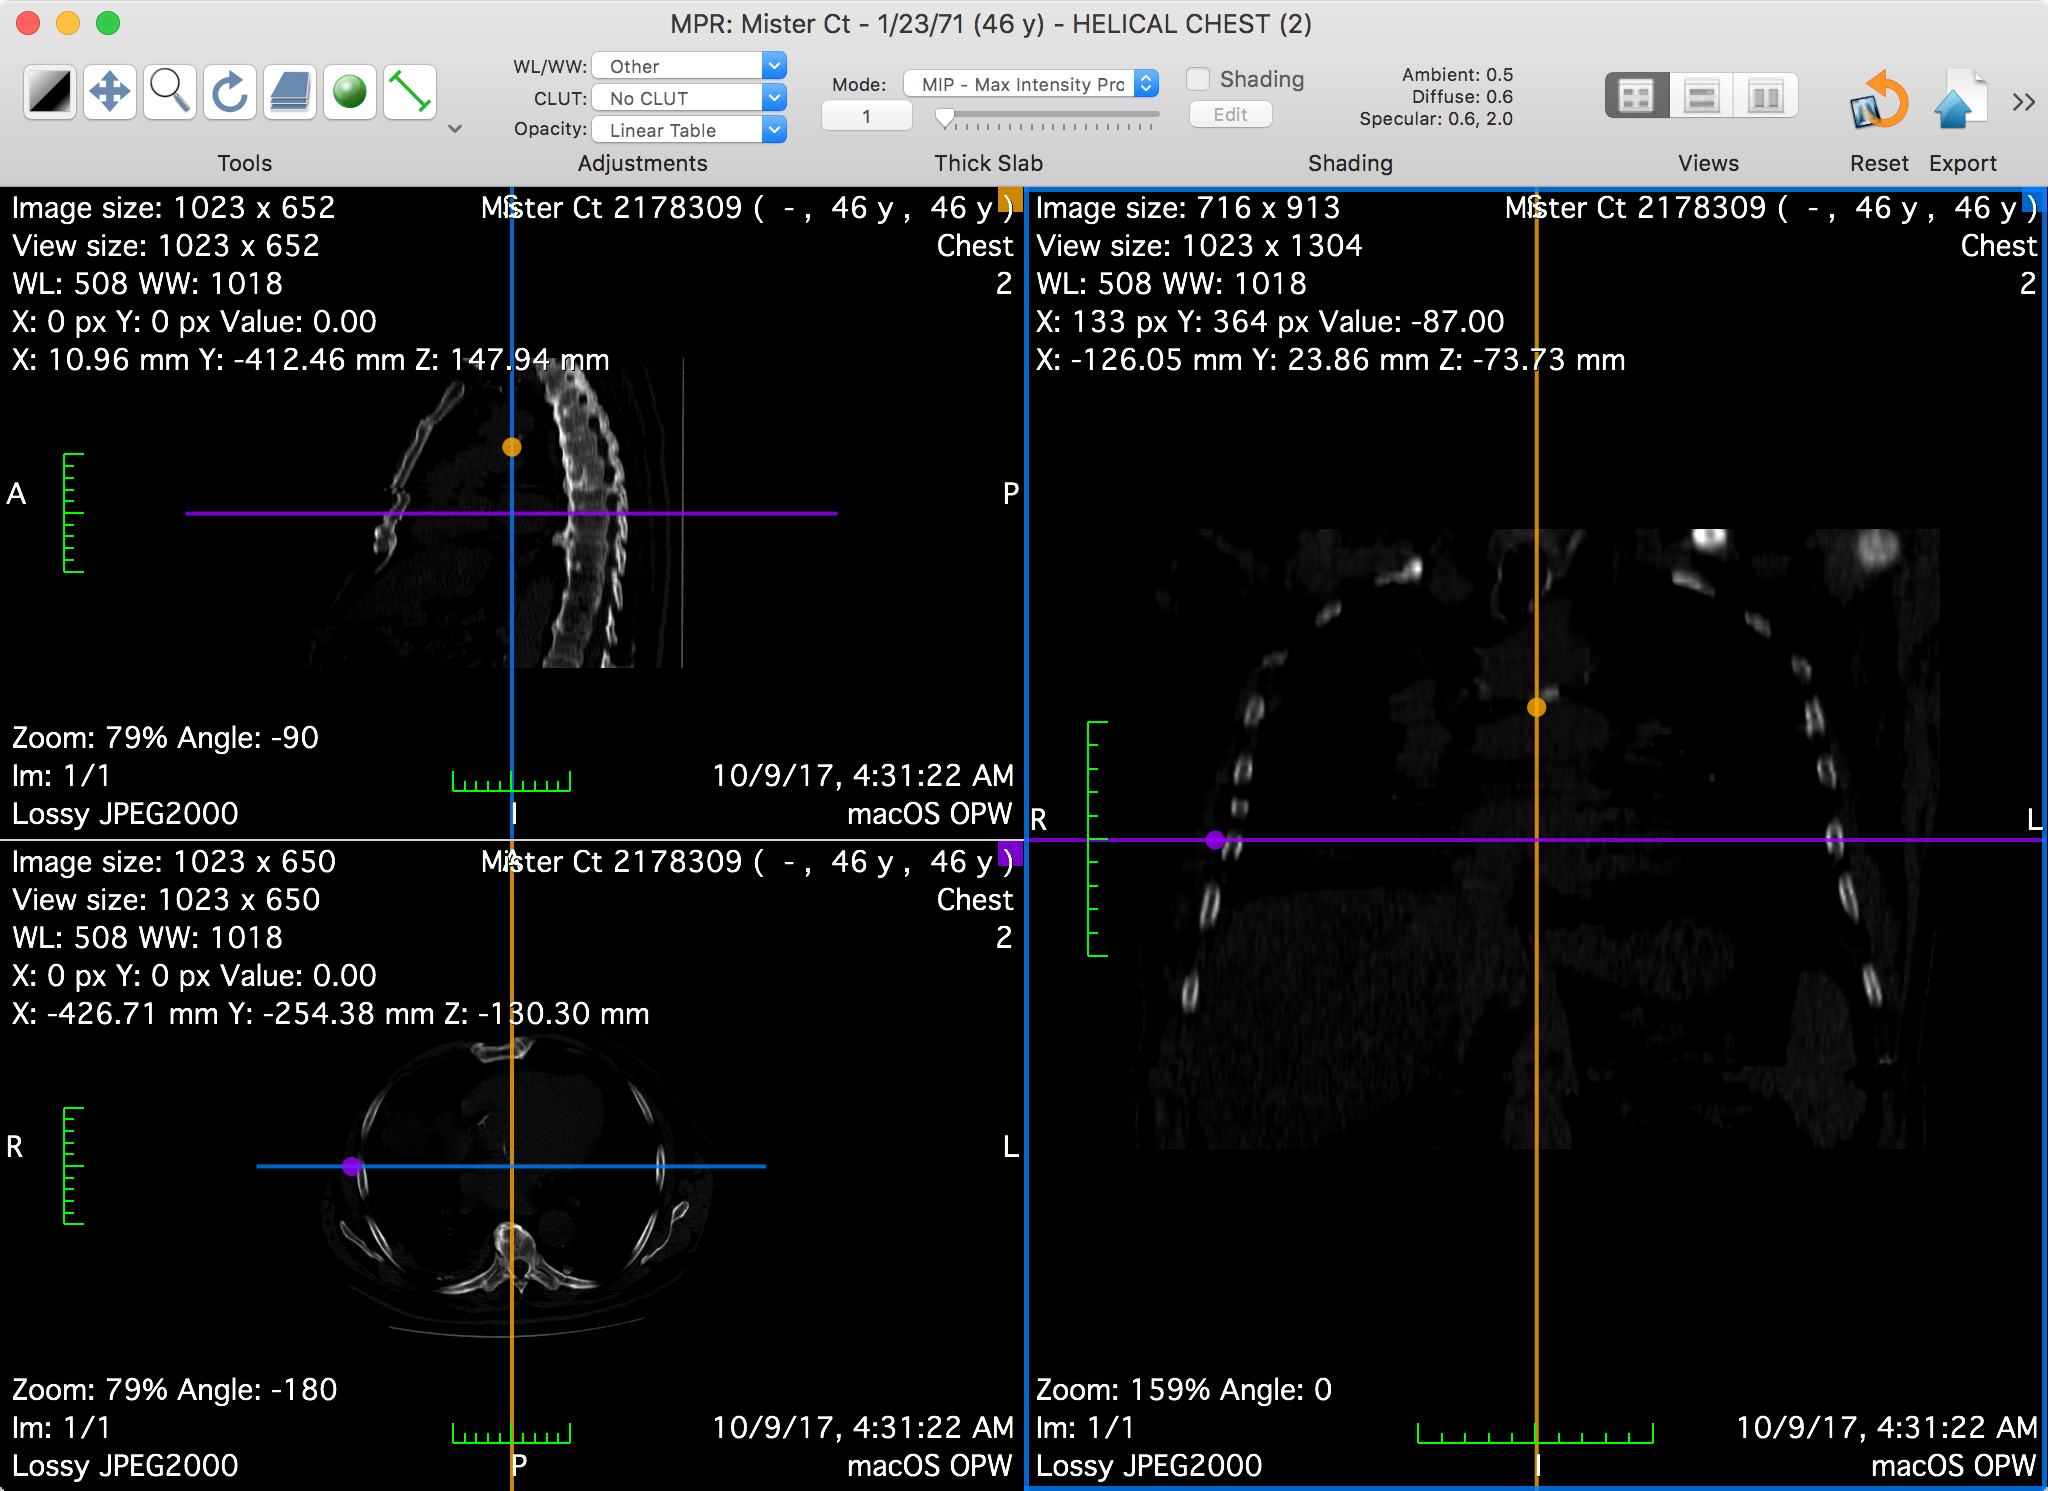
The main feature of this viewer is the possibility of reorienting the slices. To do this, you must interact with the crosslines by dragging them around the center of the view.
The crosslines are colored to reflect which projection they represent: in the screenshot above, the top-left view is identified with the yellow color, as displayed in its top-right yellow square; in the other views, the yellow crossline represents the intersection between their displayed slice and the slice displayed in the top-left view.
When hovering one of the views with the mouse, the mouse location is projected onto the view's crosslines and drawn as a circle, using the same color as the crossline. The same circles will be displayed on the other two viewers, at the same 3D location.