...
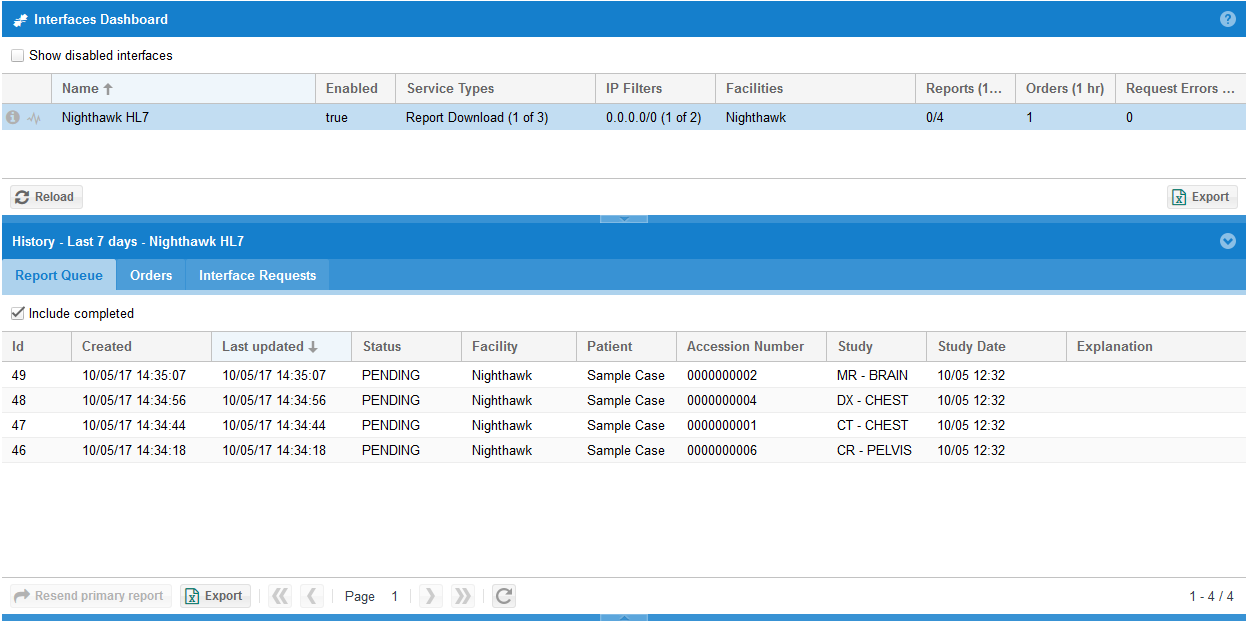
The interface dashboard may be accessed by using the Admin -> Interfaces menu option. A list of interfaces will be shown when the user has access to all of the facilities that use the interface. You can see the how many reports, orders, requests, and errors occurred in the last hour.
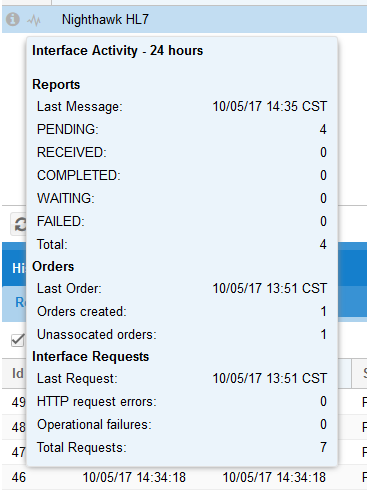
Click on an interface info toolbar icon to see more data. The details panel on the left will show information for the last 24 hours.
 On
On
the bottom, hourly data about reports, orders and API requests can be viewedClick on the graph toolbar icon. A new window will open and show data by service and hour for the last 24 hour periods. Click the checkbox to show only error data.
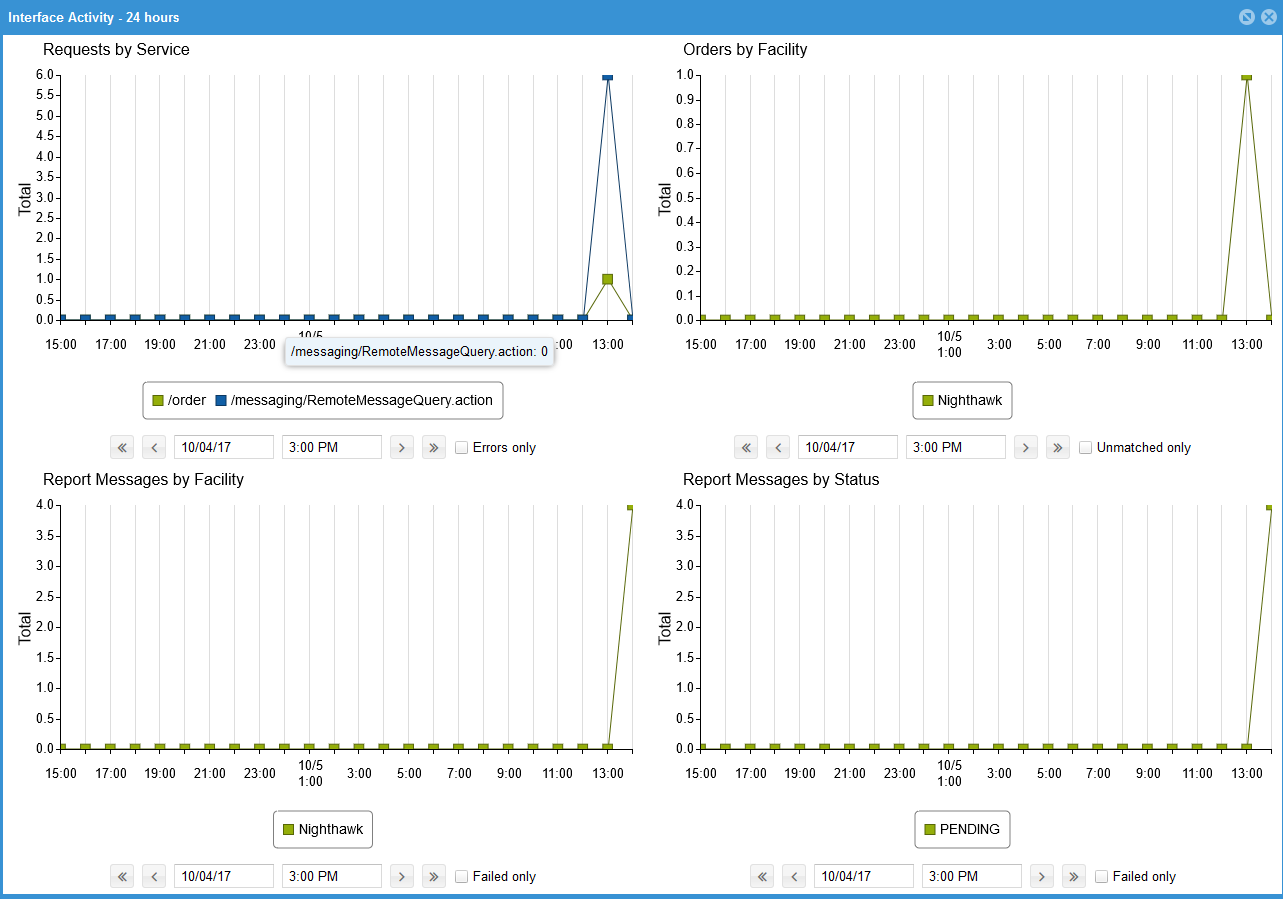
In the center bottom of the dashboard the reports, orders, and requests can be viewed.
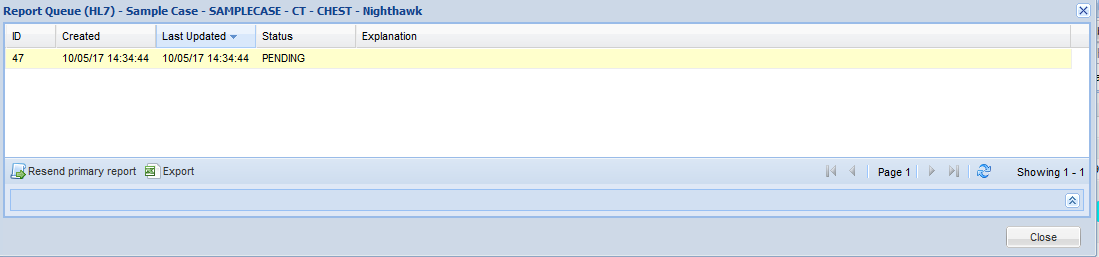
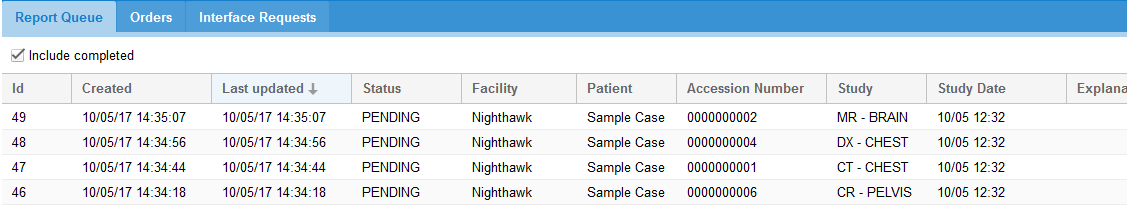
The report queue shows the reports and status of cases that are being sent. These represent HL7 ORUs that are being sent to the facility's EMR.
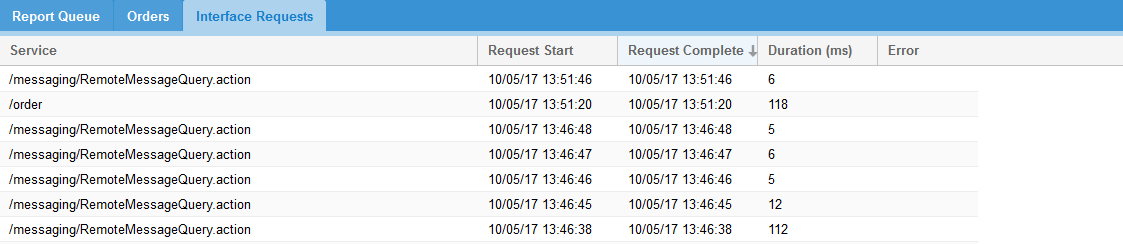
The interface requests tab shows details of all requests processed for interface.
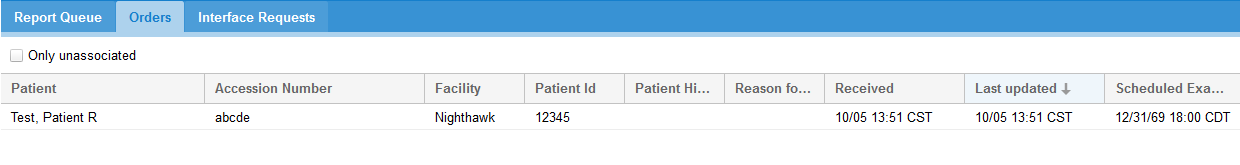
Finding orders and reports for a study
...
If you are looking for a particular order or HL7 report, the worklist order tab should be used to find orders, or the worklist should be used to find a study first and then find the HL7 Report . On the study the HL7 reports can be tracked by right clicking and using the Tools submenu to select "View Report Queue (HL7) option to view the queue for the study.