...
This toolbar can be customized just like the database window toolbar, but with other available items, which are reviewed in this section.
Main Tools
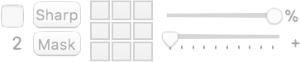
 Image Modified Image Modified | This item allows you to choose the mouse interaction effect for the right and left mouse buttons. By clicking on one of these buttons, you assign the corresponding tool to the currently selected mouse button (through the bottom radio buttons). The following tools are available: WL/WW, Pan, Zoom, Rotate and Scroll; the additional ROI tools are: Length, Angle, Rectangle, Oval, Text, Arrow, Open and Closed Polygon, Pencil, Point, Brush, Axis, Dynamic Angle, Perpendicular Lines, Repulsor and Selector. The ROI tool button function changes through the pop-up button on the right side. The WL/WW, Pan, Zoom, Rotate and Scroll tools allow you to navigate the series, while the other tools allow you to measure and quantify data through ROI creation and interaction. Refer to the ROIs section for more information about the available ROI types. |
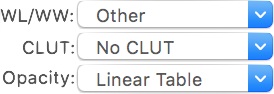 Image Modified Image Modified | While the image data is fixed, you may choose to display it differently. Through this toolbar item you may adjust the WL/WW (Window Level and Window Width, a.k.a. window center and width), the CLUT (Color Look-Up Table) and the opacity table applied to the data. WL/WW adjustments are a very common concept in DICOM viewers, allowing you to map a particular range of data values to the displayed range. CLUTs and opacity tables are another common feature, allowing you to filter the mapped values through a color/opacity table, thus displaying data in a more intuitive way, depending on the anatomy and modality. The presented pop-up buttons present the available presets, along with some additional tools. |
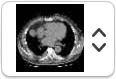
 Image Modified Image Modified | As described earlier, this popup button allows you to launch a reconstruction viewer for the currently displayed dataset. |
Data Export
...
Status, Comments and Key Images
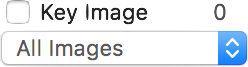 Image Modified Image Modified | This item has multiple functions, all related to the displayed image key flag and to key images in the displayed series. The top-left button is linked to the key flag of the current image: you can toggle this flag by clicking the checkbox. The top-right label indicates how many images in the current series have their key flag set. The pop-up button allows you to display all images in the series, or only those that are marked as key. |
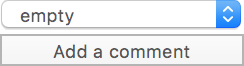 Image Modified Image Modified | This item allows you to set the displayed dataset status and comments. |
Information
 Image Modified Image Modified | This button opens the information page for the displayed dataset. This button is only enabled if the study is recognized by the OnePacs system. It requires a running and configured OnePacs Study Retriever app. |
 Image Modified Image Modified | This button opens the report for the displayed dataset. This button is only enabled if the study is recognized by the OnePacs system and if a report is available for it. It requires a running and configured OnePacs Study Retriever app. |
 Image Modified Image Modified | This button opens the report edition page for the displayed dataset. This button is only enabled if the study is recognized by the OnePacs system. It requires a running and configured OnePacs Study Retriever app. |
 Image Modified Image Modified | This button displays a list of all ROIs in the displayed image: their name, area and volume, if applicable. |
 Image Modified Image Modified | This button opens a meta-data browser for the displayed image. |
Navigation
 Image Modified Image Modified | This button toggles position synchronization between open viewers. Additional synchronization options are available in the Synchronization submenu of the Viewer menu. |
 Image Modified Image Modified | This button toggles the displayed dataset animation. When active, the current stack is automatically scrolled. Scrolling options can be set through the Rate toolbar item. These two items are dedicated to animating the series stack in its third dimension, normally Z but sometimes time or another dimension. |
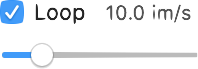 Image Modified Image Modified | This item allows you to set the options for the auto-play feature, activated through the Browse item. You may define the frame rate, and whether or not to loop over to the beginning of the series when the last frame is reached. |
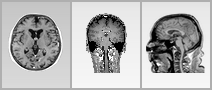 Image Modified Image Modified | These buttons allow you to display the current dataset by recombining pixels from different images into new images, displaying the result in the current viewer. This is a basic form of MPR: instead of displaying a reconstruction that is made on-the-fly, this function recomputes the new slices and lets you browse them as if these were the original dataset. |
 Image Modified Image Modified | This button displays a floating panel that allows you to reposition the data in 3D space. By adjusting the dataset position, you can manually register two datasets. However, only position shifts are allowed, no rotation or scaling. |
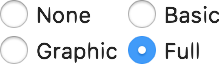
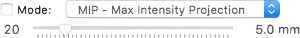
 Image Modified Image Modified | This button displays a floating panel with a basic 3D volume rendering reconstruction. |
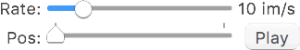 Image Modified Image Modified | This item allows you to browse the displayed dataset in the fourth dimension, normally time. It also allows you to toggle the animation in this dimension, and its frame rate. |
 Image Modified Image Modified | This button displays a floating panel that displays thumbnails for the current dataset images, like a film. |
Data
 Image Modified Image Modified | This button transforms the selected Rectangle ROI into a clipping rect. Only the values inside this rectangle will be rendered. |
 Image Modified Image Modified | This button opens an advanced interface that allows you to set specific pixel values. |
 Image Modified Image Modified | This button allows you to display the SUV values for the current PET dataset. A dedicated interface will allow you to revise the SUV calculation parameters, and to choose how the results will affect the loaded dataset. |
 Image Modified Image Modified | This button reloads the dataset from storage, undoing all changes that were applied to it. |
Presentation
Others
...