Graphical User Interface
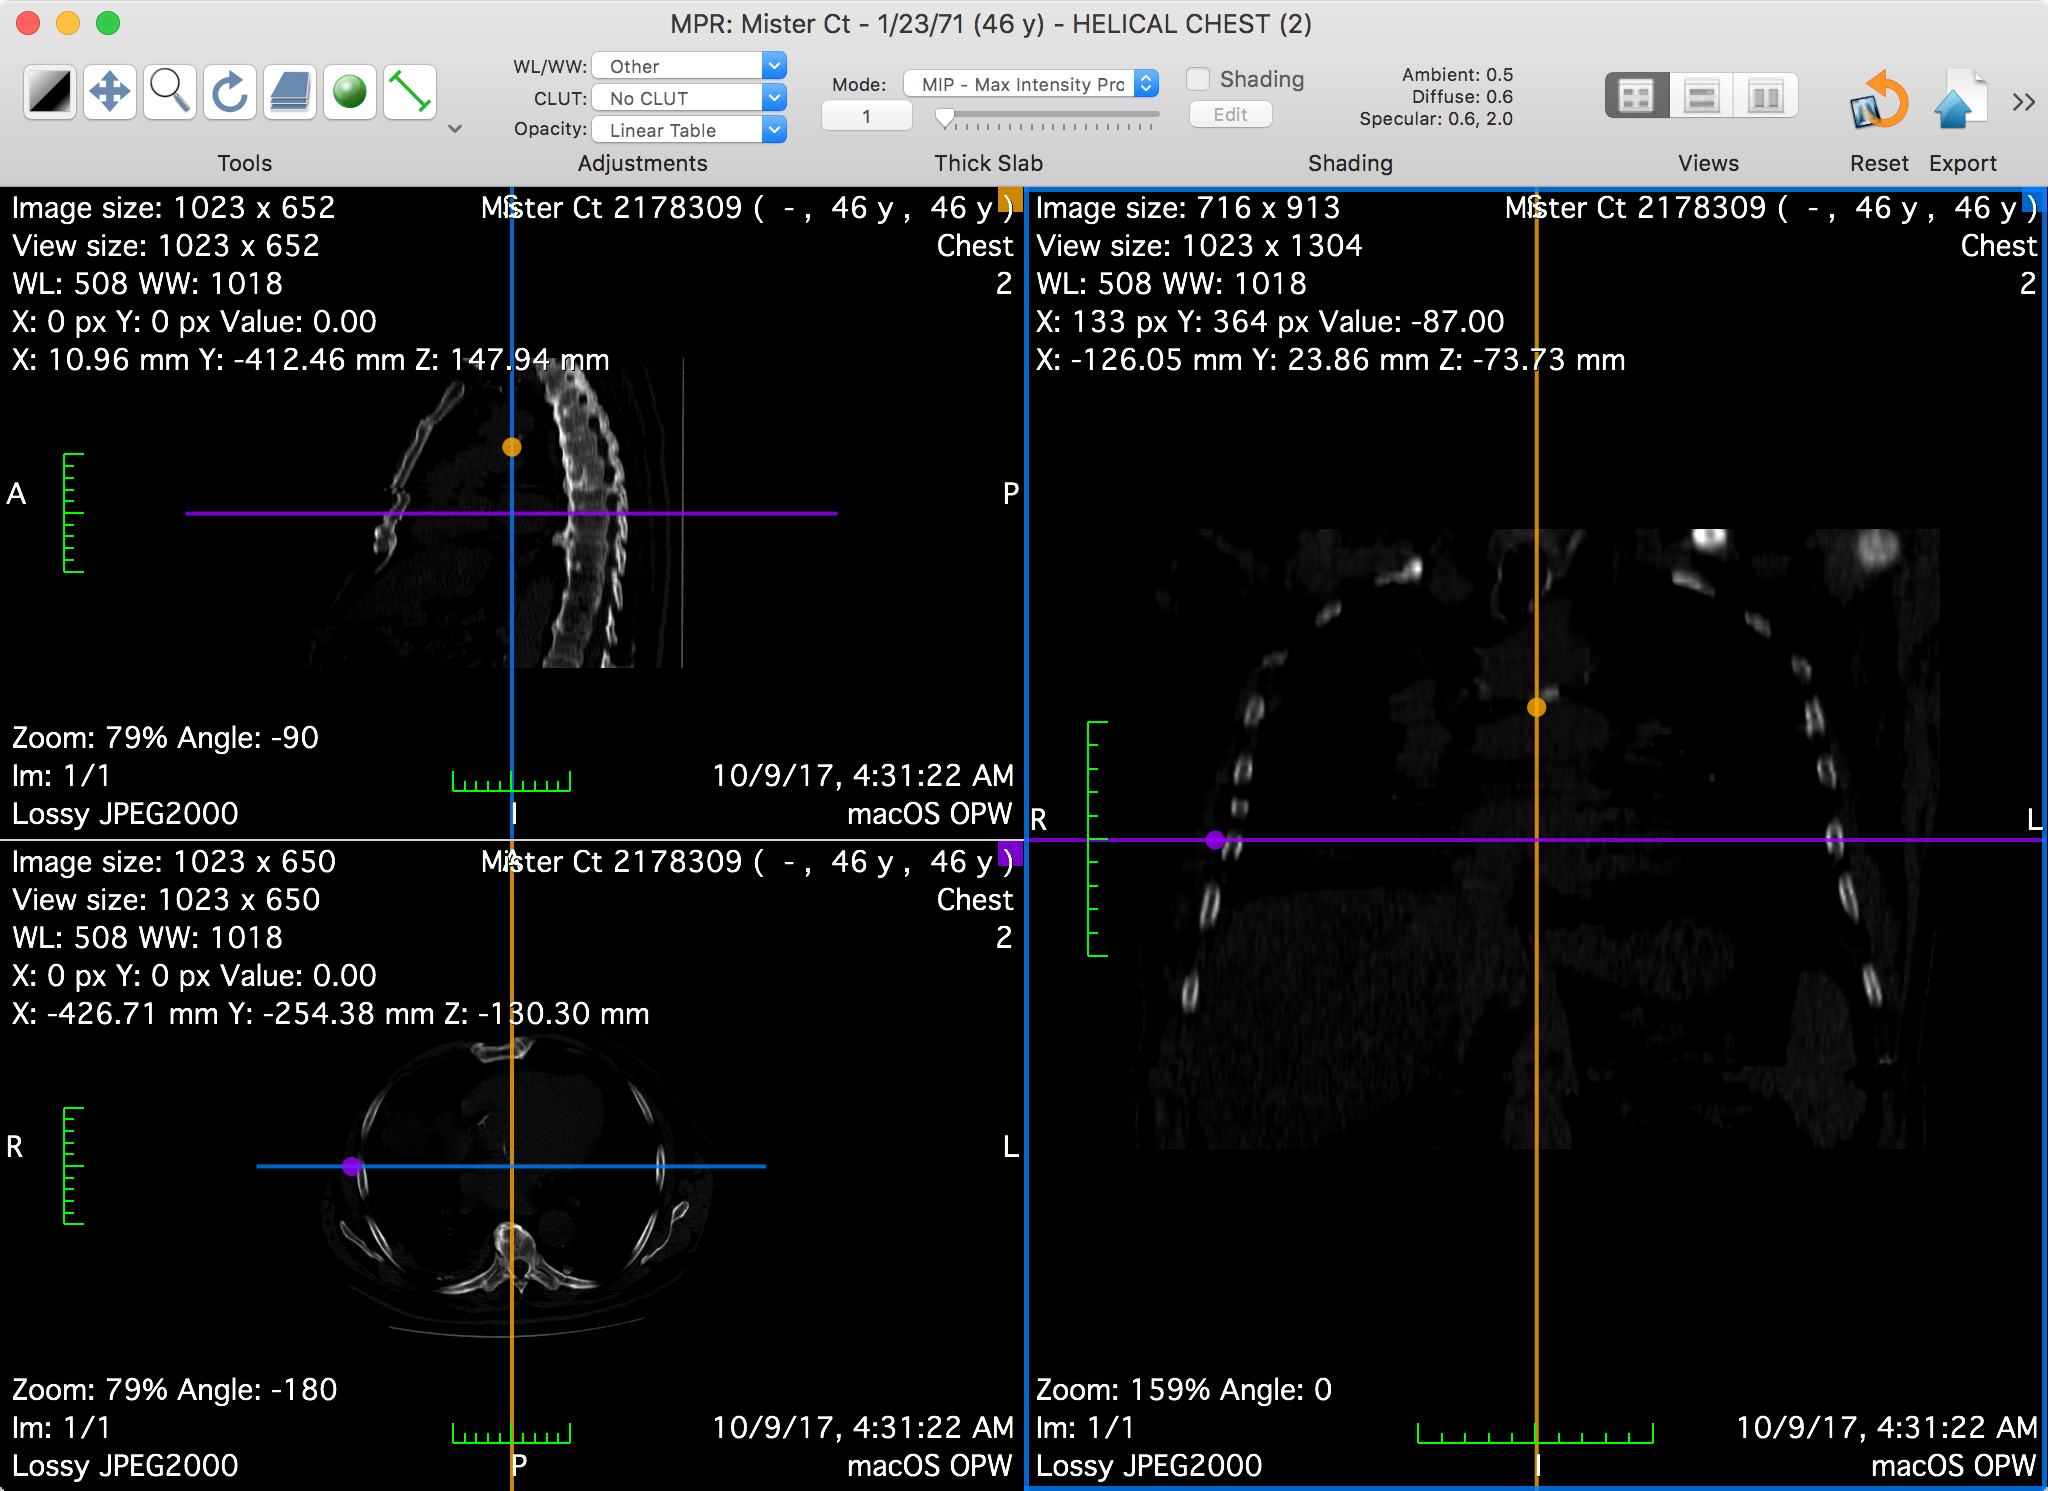
The main feature of this viewer is the possibility of reslicing the dataset in any arbitrary orientation. To do this, you must interact with the crosslines by dragging them around the view center.
The crosslines are colored to reflect which projection they represent: in the screenshot above, the top-left view is identified with the yellow color, as displayed in its top-right yellow square; in the other views, the yellow crossline represents the intersection between their displayed slice and the slice displayed in the top-left view.
When hovering one of the views with the mouse, the mouse location is projected onto the view's crosslines and drawn as a circle, using the same color as the crossline. The same circles will be displayed on the other two viewers, at the same 3D location.
The Toolbar
The viewer toolbar provides access to tools and functions that interact with the displayed dataset or with global elements of the application interface.
This toolbar can be customized just like the database window toolbar, but with other available items, which are reviewed in this section.
 Tools
Tools
You can use this item to choose the mouse interaction effect for the left mouse button. By clicking on one of these buttons, you select the corresponding tool.
The following tools are available: WL/WW, Pan, Zoom, Rotate, Scroll and Revolve; the additional ROI tools are: Length, Angle, Rectangle, Oval, Text, Arrow, Open and Closed Polygon, Pencil, Point and Brush. The ROI tool button function changes through the pop-up button on the right side.
 LOD
LOD
This item allows you to specify the level of detail used to render the displayed slices. This may come useful if the MPR viewer is too slow on your workstation: by using a more coarse setting, it will take less time to compute the slices.
 Thick Slab
You can use this item to redefine the thickness of the rendered slices, and their rendering modes.
The thickness is defined in millimeters, displayed in the lower left field. It can be adjusted using the lower right slider.
The available rendering modes are the following: maximum intensity projection, minimum intensity projection, mean intensity projection and volume rendering.

