The viewer window is the principal image viewer in OnePacs Workstation for macOS. Generally speaking, opening a dataset in the app refers to opening a 2D viewer to display that dataset.
While this viewer focuses mainly on a basic representation of the dataset, slice by slice, it also provides a few reconstruction functions. Among others, you may for example use the viewer to display thick slices in MiP, maxIP and meanIP modes, or you may reorient the slices and display their orthogonal representations.
More advanced reconstruction methods are available through the 3D menu or the 2D/3D toolbar item:
| Children Display |
|---|
| Note | ||
|---|---|---|
| ||
| Derived images, such as those resulting from 3D visualization tools, are utilized, it must be remembered that such images are based on calculations extrapolated from the original imaging data. Accordingly they should be interpreted only in association with and along with the source images. |
Graphical User Interface
Almost all of the viewer window is dedicated to the viewed image, but at the top of the window you will find the images slider.
However, two additional user interface elements are displayed in the viewer screen, in separate windows, and must be considered as part of the viewer: the shared toolbar and the series list. Many viewer windows can be open at the same time, and they all share these two additional windows.
The Toolbar
The viewer toolbar provides access to tools and functions that interact with the displayed dataset or with global elements of the application interface. As previously indicated, to optimize screen space only one toolbar is displayed, linked to the active viewer window.
This toolbar can be customized just like the database window toolbar, but with other available items, which are reviewed in this section.
Tools
This item allows you to choose the mouse interaction effect for the right and left mouse buttons. By clicking on one of these buttons, you assign the corresponding tool to the currently selected mouse button (through the bottom radio buttons).
The following tools are available: WL/WW, Pan, Zoom, Rotate and Scroll; the additional ROI tools are: Length, Angle, Rectangle, Oval, Text, Arrow, Open and Closed Polygon, Pencil, Point, Brush, Axis, Dynamic Angle, Perpendicular Lines, Repulsor and Selector. The ROI tool button function changes through the pop-up button on the right side.
The WL/WW, Pan, Zoom, Rotate and Scroll tools allow you to navigate the series, while the other tools allow you to measure and quantify data through ROI creation and interaction. Refer to the ROIs section for more information about the available ROI types.
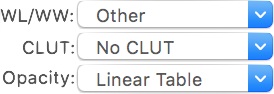 Adjustments
While the image data is fixed, you may choose to display it differently. Through this toolbar item you may adjust the WL/WW (Window Level and Window Width, a.k.a. window center and width), the CLUT (Color Look-Up Table) and the opacity table applied to the data.
WL/WW adjustments are a very common concept in DICOM viewers, allowing you to map a particular range of data values to the displayed range. CLUTs and opacity tables are another common feature, allowing you to filter the mapped values through a color/opacity table, thus displaying data in a more intuitive way, depending on the anatomy and modality.
The presented pop-up buttons list the available presets, along with some additional tools.
2D/3D
As described above, this popup button allows you to launch a reconstruction viewer for the currently displayed dataset.
Send
This button opens the DICOM Send interface, allowing you to send the displayed dataset to a configured DICOM node. Along with other options, you can choose to send the currently displayed image only, or the entire series.
DICOM Export
This button allows you to save the currently displayed dataset as a new DICOM series. Along with other options, you can choose to send the currently displayed image only, or the entire series.
Save/Load PR
This button allows you to save the current presentation state to your OnePacs account or to load a previously saved presentation state. It is only enabled if the selected study is recognized by the OnePacs system. It requires a running and configured OnePacs Study Retriever app.
To save the current presentation state, simply click the button and the PR saving interface will appear. To apply a previously saved PR, click and hold the button, and a menu will appear. By choosing an item in the menu, the corresponding PR will be applied to the viewer.
Photos
This button captures the displayed image and adds is to your Photos app library.
Movie Export
This button allows you to create a movie file with the current dataset.
Email
This button captures the displayed image and attaches it to a newly created email message in the Mail app.
Print
This button triggers the DICOM print interface.
Key Images
This item has multiple functions, all related to the displayed image key flag and to key images in the displayed series.
The top-left button is linked to the key flag of the current image: you can toggle this flag by clicking the checkbox. The top-right label indicates how many images in the current series have their key flag set. The pop-up button allows you to display all images in the series, or only those that are marked as key.
Status & Comments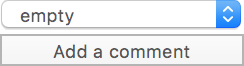
This item allows you to set the displayed dataset status and comments.
Info
This button opens the information page for the displayed dataset.
This button is only enabled if the study is recognized by the OnePacs system. It requires a running and configured OnePacs Study Retriever app.
View
This button opens the report for the displayed dataset.
This button is only enabled if the study is recognized by the OnePacs system and if a report is available for it. It requires a running and configured OnePacs Study Retriever app.
Write
This button opens the report edition page for the displayed dataset.
This button is only enabled if the study is recognized by the OnePacs system. It requires a running and configured OnePacs Study Retriever app.
ROI Manager
This button displays a list of all ROIs in the displayed image: their name, area and volume, if applicable.
Meta-Data
This button opens a meta-data browser for the displayed image.
Sync
This button toggles position synchronization between open viewers.
Additional synchronization options are available in the Synchronization submenu of the Viewer menu.
Browse
This button toggles the displayed dataset animation. When active, the current stack is automatically scrolled.
Scrolling options can be set through the Rate toolbar item. These two items are dedicated to animating the series stack in its third dimension, normally Z but sometimes time or another dimension.
Rate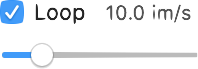
This item allows you to set the options for the auto-play feature, activated through the Browse item.
You may define the frame rate, and whether or not to loop over to the beginning of the series when the last frame is reached.
Orientation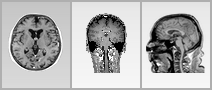
These buttons allow you to display the current dataset by recombining pixels from different images into new images, displaying the result in the current viewer. This is a basic form of MPR: instead of displaying a reconstruction that is made on-the-fly, this function recomputes the new slices and lets you browse them as if these were the original dataset.
3D Position
This button displays a floating panel that allows you to reposition the data in 3D space. By adjusting the dataset position, you can manually register two datasets. However, only position shifts are allowed, no rotation or scaling.
3D Panel
This button displays a floating panel with a basic 3D volume rendering reconstruction.
4D Player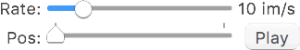
This item allows you to browse the displayed dataset in the fourth dimension, normally time. It also allows you to toggle the animation in this dimension, and its frame rate.
Navigator
This button displays a floating panel that displays thumbnails for the current dataset images, like a film.
Shutter
This button transforms the selected Rectangle ROI into a clipping rect. Only the values inside this rectangle will be rendered.
Set Pixels
This button opens an advanced interface that allows you to set specific pixel values.
SUV
This button allows you to display the SUV values for the current PET dataset.
A dedicated interface will allow you to revise the SUV calculation parameters, and to choose how the results will affect the loaded dataset.
Revert
This button reloads the dataset from storage, undoing all changes that were applied to it.
Propagate
This button toggles the propagation of visual adjustments between open viewers.
Additional propagation options are available in the Viewer menu.
Flip Horizontal
This button flips the displayed image horizontally.
Flip Vertical
This button flips the displayed image vertically.
Flip
This button inverts the display order of images in the current dataset.
Annotations
These buttons allow you to filter a subset of text annotations to be displayed on the viewer edges.
Thick Slab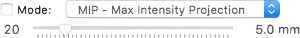
This button allows you to enable and configure thick slice rendering for the current series.
You may choose between MiP, maxIP, meanIP and volume rendering, and specify the thickness.
RGB Factors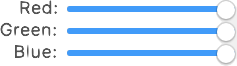
These sliders allow you to define factors for the RGB channels when displaying color images.
Fusion
This item allows you to adjust the way a fused dataset is displayed on top of the base dataset.
Subtraction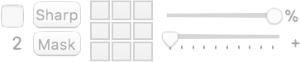
This item allows you to adjust the position and sharpness of a subtracted image.
Convolution
This pop-up button allows you to apply a convolution filter to the displayed image.
Reset
This button allows you to reset the display adjustments to the their initial state.
Patient
These buttons allow you to switch to the previous or next patient, in the order displayed in the database window.
Series Selection
This pop-up button allows you to switch to another series of the same patient.
Series
These buttons allow you to switch to the previous or next series of the same study, in the order displayed in the database window.
Windows Tiling
This pop-up button allows you to choose how windows should be positioned on the screen, and repositions windows accordingly.
Tile
This button repositions the viewer windows so they occupy the available screen space.
Database
This button closes all viewer windows and brings the database window to front.
Growing
This button opens a panel that allows you to define a new mask ROI by using a region growing segmentation algorithm.
Cobb
This button toggles the display of Cobb angles in Length ROI information boxes.
Space and Flexible Space
The system-defined space and flexible space items allow you to separate the toolbar items in groups.
The Series List
The series list allows you to open other series that belong to the same patient. It displays thumbnail buttons of these series in their hierarchy.
By clicking these buttons, the corresponding series is loaded in the current viewer. By right-clicking them, the corresponding series are loaded in new viewer windows.
The series buttons also represent the role of the corresponding series through a color-coded background:
- Gray: the default, non-specific color;
- Red: the button represents the series displayed in the active viewer;
- Yellow: the button represents a series that is displayed in a non-active viewer;
- Green: the button represents a series that is fused with the active viewer.
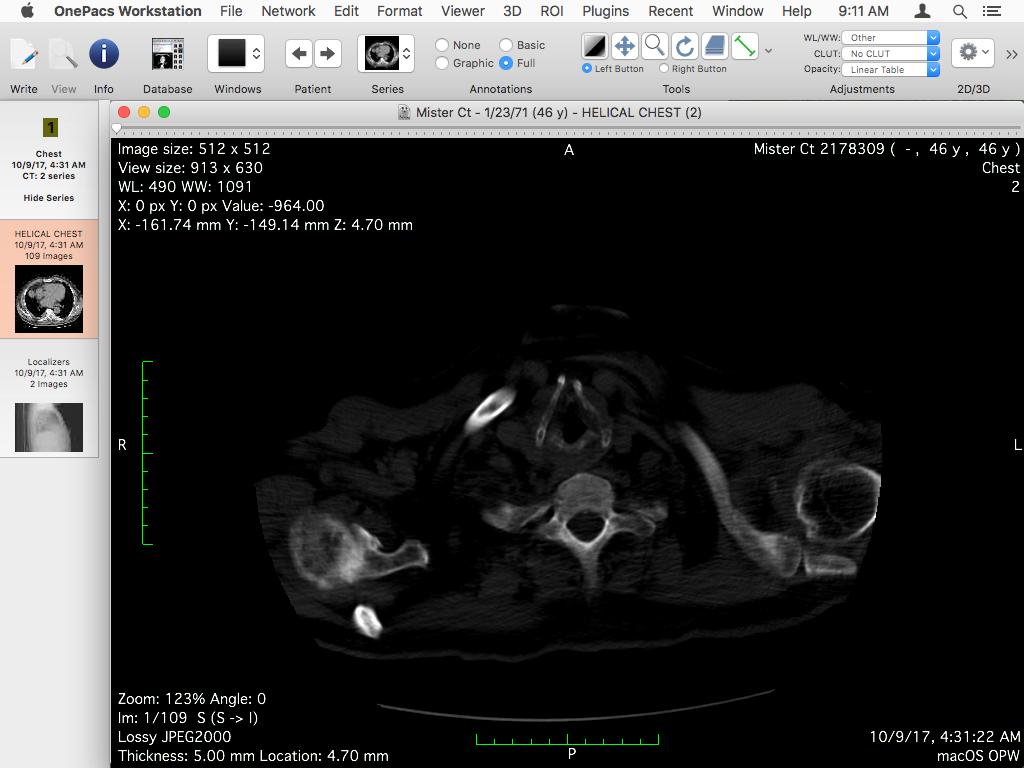
The Viewing Area
The viewing area is the main element of the viewer: it displays the current image or basic reconstructions, depending on your usage. This whole page describes how to use its components.
The Slider
Positioned at the top of the viewing area and spanning its whole width, the slider allows you to switch between images of the currently loaded stack and displays the current index.
Keyboard Modifiers
| Anchor | ||||
|---|---|---|---|---|
|
When navigating the viewer to focus on a particular area, having to switch between tools can be annoying, even if you have adopted the keyboard shortcuts.
Without having to switch from the default WL/WW tool, you can change the left mouse button behavior by pressing the following keys:
- While pressing the Command key (⌘), mouse interaction is linked to panning;
- While pressing the Option key (⌥), mouse interaction is linked to rotation;
With the right mouse button being by default linked to zooming, and with the mouse scroll wheel being linked to series scrolling, with these keyboard modifiers you have stateless access to all the viewer navigation tools.
Measurements and Quantification
When hovering the image displayed in the viewing area, OnePacs Workstation for macOS displays the pixel value at the location of your mouse pointer in the text annotations.
However, more advanced measuring tools allow you to quantify and measure the images by defining ROIs.
ROIs
| Anchor | ||||
|---|---|---|---|---|
|
A ROI, short for Regions of Interest, generally allows you to define a region of an image and obtain statistics about the underlying image values.
Many different shapes are allowed in the app:
- Point
- Distance (line)
- Arrow
- Rectangle
- Oval
- Angle
- Text
- Open Polygon
- Closed Polygon
- Pencil
- Brush
- Axis
- Dynamic Angle
- Perpendicular Lines
Most of these are self-describing and don't require a detailed description. Generally, you can can create these ROIs by choosing the corresponding tool and then clicking and dragging within the viewing area, once or multiple times.
Certain ROI types are actually composite objects, defined by multiple points that you reposition in order to obtain the desired measurement. Other ROI types won't report underlying image value statistics, as they may have other purposes, or their purpose may be strictly visual.
Tools
The choice done in the Tools toolbar item defines what action is applied when you interact with the viewer using the mouse.
The following tools are available:
- WL/WW, to adjust the contrast and brightness windowing applied to the image;
- Pan, to move the image in the viewer;
- Zoom, to magnify the image;
- Rotate, to rotate the image;
- Stack, to switch between the loaded images;
- ROI, to create new ROIs and interact with them.
The actual function of the ROI tool can be further defined through the pop-up menu available in the down arrow of the Tools toolbar item. You may choose between the aforementioned ROI types and the extra Selector and Repulsor tools.
Calibration
To calibrate a viewer, create a distance ROI and double-click it to open its information panel. Click the Recalibrate button and you'll be able to redefine the ROI length. The app scales the viewer pixel size to match the entered value. All measurements done in this viewer are consequently updated.
SUV
PET dataset values are displayed as raw pixels. Depending on the modality, this information can be converted to SUV (Standardized Uptake Value). The SUV toolbar button and the Convert from/to SUV item of the Viewer menu allow you to switch between RAW and SUV values, and shows an interface that presents the conversion parameters, allowing you to adjust these.
Synchronization and Propagation
When viewing multiple series at the same time, you may want your actions to be applied to all the open viewers, or to all images in the current stack.
The term synchronization refers to keeping different viewers aligned on the same position in patient space, if possible. This function may seem trivial, but it actually incurs many complications that are addressed with different techniques.
Straightforward synchronization is only possible between series of the same study that have been properly created with correct orientation and size information. If this information is missing or wrong, successfully synchronizing two series of images may be challenging. By default, the app doesn't try to synchronize series belonging to different studies. To enable this, you may use what is offered in the Viewer menu, in the Synchronization submenu.
The term propagation refers to applying the same adjustments to different viewers, i.e. WL/WW. The Viewer menu allows you to toggle this function for different usages.
Crosslines
Crosslines are reference lines. When multiple viewers are open, these lines are drawn on a viewer to represent the location where the images displayed in other viewers cross the image currently displayed in this viewer, or to display the range of images available in the other viewer.
The Crosslines toolbar item toggles their display.
Fusion
OnePacs Workstation for macOS allows you to fuse two series so they're displayed in the same viewer. To set up this function, you must first open the two series in two dedicated viewers. Then, drag the icon from the secondary dataset viewer titlebar onto the primary viewer content. The app will display an interface allowing you to specify how to fuse these two series.
Annotations
| Anchor | ||||
|---|---|---|---|---|
|
Text annotations are used to display information about the displayed image in the viewer corners.
The Annotations preferences allow you to specify what shall be displayed in the text annotations by defining specific sets for every dataset type, or by modifying the generic annotations setting. The app supports any DICOM field, database data and additional fields.
You can temporarily disable or limit this feature through the Viewer menu Annotations submenu or the Annotations toolbar item. For example, you may temporarily remove personal information from the viewer, while still displaying other fields, by choosing the basic setting.